Sales User Guide
Sales Dashboards
Sales, CRM, quote approval, lead performance, ownership transfer, and executive reporting
Sales App Dashboards
The Sales app includes these primary dashboards:
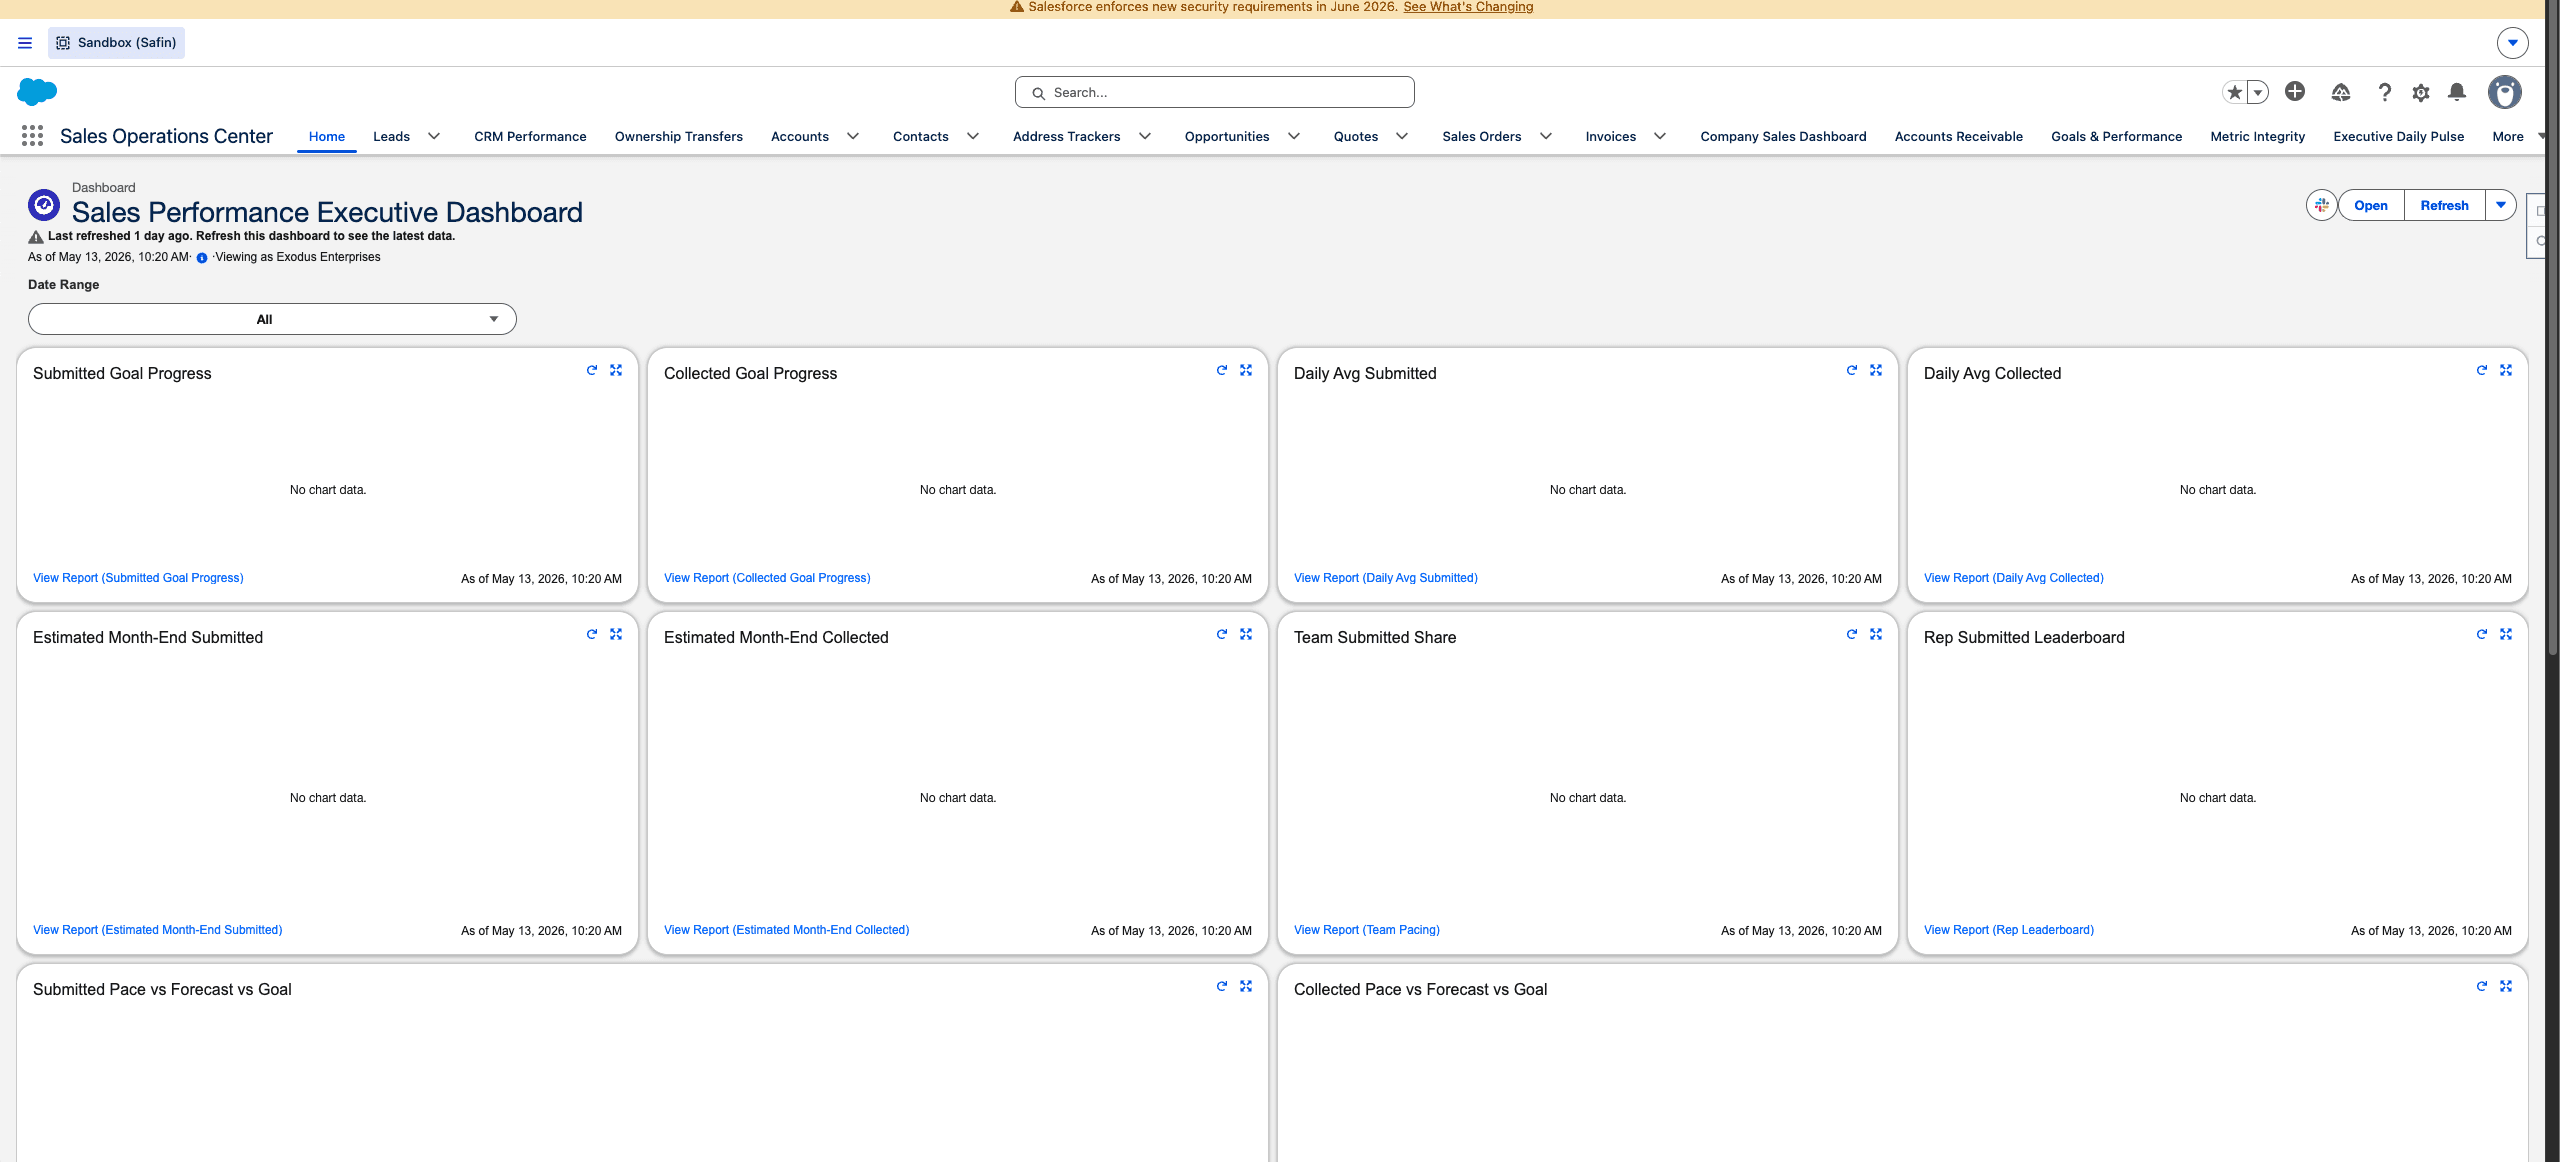
Safin dev sandbox Sales Operations dashboard, captured from the browser content area without Chrome tabs or desktop chrome.
| Dashboard | Use |
|---|---|
| Lead Performance Dashboard | Lead activity, conversion, follow-up, and rep performance. |
| CRM Performance Dashboard | Account, campaign, opportunity, lead, and customer touch health. |
| Ownership Transfer Dashboard | Transfer volume, handoff quality, and recipient follow-up. |
| Company Sales Dashboard | Sales submitted and collected, pacing, business mix, and rep leaderboard. |
| Accounts Receivable Dashboard | Overdue balances, collections, aging, and account exposure. |
| Quote Approval Dashboard | Pending approvals, decision trends, rejected reasons, and high-value requests. |
| Executive Daily Pulse | Executive view of current operational health. |
| Metric Integrity Dashboard | Dashboard data quality and operational issue visibility. |
Rep Expectations
Sales reps should monitor their assigned Leads, follow-up tasks, open opportunities, quotes pending action, outstanding payment items, and customers needing touch.
Manager Expectations
Managers should use dashboards to find gaps that block revenue:
- Leads with no future follow-up.
- Connected calls without next steps.
- High-value untouched Accounts.
- Quotes pending too long.
- Orders or invoices waiting for payment collection.
- Customers with overdue receivables.
Report Drill-Down
Dashboards are summary views. Use the underlying reports when a number looks wrong or when a user needs the exact record list behind a metric.
Last updated on